
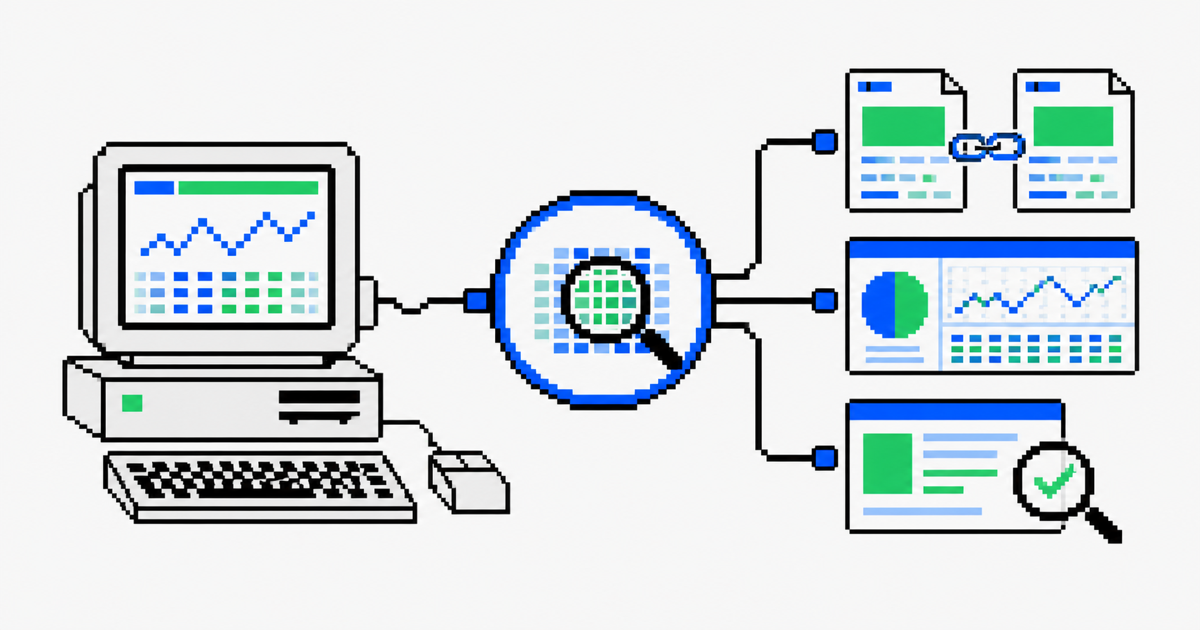
A practical Search Console workflow for WordPress
How to Analyze Google Search Console Data for a WordPress Site
Google Search Console contains some of the best evidence available for improving organic search performance. The challenge is not finding clicks and impressions; it is identifying the relationships behind them at a scale that supports sensible editorial decisions. This guide covers the three datasets that matter most and compares native Search Console, Looker Studio, and WPGator Search Insights.
Native Search Console
Best for checking a question, URL, or query directly against Google’s source data.
Looker Studio
Best for configurable reports, stakeholder dashboards, and combining multiple data sources.
Search Insights
Best for WordPress-native query-to-page research and content-opportunity review.
The three Search Console datasets worth analyzing
Do not begin with a vague goal such as “find more keywords.” Begin with an answerable question. The most useful Search Console analysis usually falls into one of three datasets.
1. Queries and related pages
Which URLs does Google show for a particular query? Is one page clearly dominant, or are several URLs receiving visibility for the same topic?
2. Search-term mentions on pages
Does the current landing page mention the phrase Google associates with it in the title, headings, body, links, or URLs?
3. Performance movement over time
Which queries are gaining, declining, or changing in clicks, impressions, CTR, and average position against a meaningful prior period?
These datasets complement each other. A declining query might not need new copy if the right page remains clearly relevant. A term with rising impressions may need a stronger heading or internal link. Several pages appearing for one query may reflect healthy topical coverage—or potential overlap worth investigating.
Use the data to investigate, not to automate rewrites. Search Console reveals what Google has shown and how searchers responded. It does not prove that adding an exact phrase, changing a title, or merging pages will improve performance. Check the live SERP, the search intent, the query-to-page relationship, and the quality of the existing content before acting.
Dataset 1: queries and the pages Google connects to them
This relationship sits behind many content-decay and possible cannibalization investigations. Start with a query, then inspect the pages Google has shown for it. Google’s own guidance explains that you can select a query in the Performance report and then open the Pages tab to see the associated URLs.
The limitation is scale. Native Search Console works well for investigating an individual term, but it does not automatically create a prioritized editorial queue of query-to-page relationships. To compare many terms, you generally repeat the filtering process, export report tables, and combine the results yourself.
Aggregation also matters. Search Console’s chart data is aggregated by property, while page-level tables are aggregated by page. That can produce apparently different totals. Treat a query-to-page relationship as evidence for review, not a simple one-query-to-one-URL map.
Dataset 2: exact phrase mentions versus Google visibility
Search Console can show that a page earns impressions for a query. It cannot tell you whether that phrase appears in the page title, headings, body copy, anchor text, or href values. Google can understand semantic relevance and synonyms, so an exact match is not a ranking requirement. However, the comparison remains useful for editorial review.
A page may earn impressions for an important question but answer it only indirectly. That can justify a genuinely helpful section, a clearer heading, an internal link to a deeper resource, or a decision that another page should serve the query instead. It is not a reason to insert phrases mechanically.
Dataset 3: period-over-period movement
Clicks alone are not enough. A page can keep its click count while losing impressions, gain impressions while losing click-through rate, or move in average position without meaningful traffic change. Compare a current period with a prior period, then review clicks, impressions, CTR, and average position together.
Google recommends focusing more on trends in impressions and clicks than treating average position as a conventional rank-tracking number. Identify meaningful movement first, then inspect the query, related pages, current search result, and the content itself.
Three ways to analyze Search Console data
| Question to answer | Native Search Console | Looker Studio | WPGator Search Insights |
|---|---|---|---|
| Which pages appear for this query? | Select a query, then open the Pages tab. Effective for one-off investigation. | Build a report using the URL Impression source with Query and Landing Page dimensions. | Query-to-page drill-downs show page share, the current primary page, and multiple-page visibility. |
| Does the page mention this query? | Open the page manually and inspect its content. | Requires a separate crawl, sheet, script, or external content source. | Search Term Mentions checks an exact phrase across title, headings, body text, links, and href values. |
| Which queries changed most? | Use date comparison, sort by difference, and export the report view where needed. | Build date controls, comparison charts, and calculated fields in a custom dashboard. | Current and previous 28-day periods are prepared with 90-day context and opportunity filters. |
| Search type and device scope | Supports available Search Console report types and device filters in the interface. | Supports configured Search Console report types and dimensions through its data sources. | V1 analyzes Web Search only; device, Image, Video, News, Discover, and Google News datasets are not included. |
| Where does the report live? | Inside Google Search Console. | Inside a Google-hosted custom dashboard. | Inside WordPress admin, with synchronized report data stored locally. |
Query-to-page relationships
Content coverage and phrase mentions
Performance changes and workflow
Method one: analyze data in native Google Search Console
Native Search Console should remain part of every SEO workflow. It is the original data source, free to use, and often the fastest place to validate a single question. Review queries, pages, countries, devices, dates, and performance comparisons directly in the Performance report.
- Set a useful time range. Compare a recent period with an equivalent previous period where appropriate. Avoid conclusions based on only a few days of movement.
- Start with Queries or Pages. Sort by clicks, impressions, CTR, average position, or comparison difference based on the question being asked.
- Drill into the relationship. Select a query and open the Pages tab, or select a page and inspect the query mix.
- Export only when needed. Download a filtered report to a spreadsheet when you need notes, prioritization, or additional calculations.
This approach is excellent for periodic checks and single-page investigations. It becomes slower when the goal is to build a reusable prioritization system across hundreds or thousands of query-page combinations. Direct report exports are limited to the representative rows shown in the report, and some low-volume or privacy-sensitive queries are omitted from query tables.
Method two: build a Looker Studio report
Looker Studio, formerly Google Data Studio, is Google’s self-service reporting and visualization platform. It is a strong option when you need a custom dashboard, want to combine Search Console with Analytics or other sources, or need recurring stakeholder reporting.
The Search Console connector offers two important choices: Site Impression and URL Impression. A single data source uses one or the other. Site Impression supports property-level performance context, while URL Impression is the appropriate choice when you need query and landing-page analysis.
- Connect the verified property. Select URL Impression for page-level query analysis.
- Create a query-to-page table. Add Query and Landing Page dimensions, then clicks, impressions, CTR, and average position.
- Add date comparisons. Configure a meaningful default period and prior-period comparison.
- Create filters and calculated fields. Define the thresholds that matter to your own editorial process.
- Test totals and edge cases. Check samples against Search Console, particularly when switching between property and URL-level reporting.
Looker Studio can produce an excellent SEO dashboard, but it is a report builder rather than a finished content-opportunity workflow. A robust report can take significant time to design and test, especially when it needs multiple sources, calculated fields, reusable filters, and stakeholder-friendly views. It also cannot perform on-page content mention checks unless you add a separate crawl or content dataset.
Method three: analyze data inside WordPress
WPGator Search Insights is designed for site owners who want a focused Search Console workflow without another tracking platform or dashboard-building project. It connects to a selected verified Google Search Console property with read-only access, uses Site Impression and URL Impression datasets, and stores synchronized reports in the WordPress database.
After synchronization, Opportunities, Queries, and Landing Pages can be reviewed directly in wp-admin. Filters help focus by impressions, clicks, CTR, average position, and opportunity type. Optional Query Lenses can inspect question-form, test-answer, local-search, and potential-commercial patterns without assigning permanent intent scores to the data.
V1 scope: WPGator Search Insights currently analyzes Web Search data only. Device reporting and Image, Video, News, Discover, and Google News datasets are intentionally excluded from V1. Search Console treats these as discrete API datasets, and adding them requires additional synchronized report tables in WordPress.
That focused scope keeps the first version centered on the Web Search data most WordPress publishers use for content maintenance and opportunity analysis. It avoids additional database tables and interface complexity for report types a site owner may never need.
Use opportunity labels as a triage aid. Defend, Recover, Grow, and Review are property-relative signals, not automated instructions to rewrite a page. Use them to decide where to investigate, then check the SERP, query-page relationship, and existing content before publishing a change.
Choosing the right Search Console workflow
Use native Search Console when you are checking a single query, validating a page, or performing a light monthly review. It is direct and authoritative, but repeated analysis and exports can become manual.
Use Looker Studio when you need a custom reporting layer, cross-source visualization, or recurring stakeholder dashboards. It is flexible, but that flexibility means configuration work and ongoing report ownership.
Use WPGator Search Insights when your primary work happens in WordPress and you want a faster path from Search Console evidence to an editorial task: identify movement, inspect related pages, check content coverage, and export the filtered report when needed.
Turn Search Console data into a WordPress content workflow
Connect a verified property, synchronize your reports, and start with the queries and pages that show the strongest evidence of change or opportunity.